Firebase
Overview
Firebase is a Google Cloud system which can capture analytics, performance, and crash data from our deployed app. The Firebase Console offers an overview into the app
- If you are unable to access the console, request access from the team or project lead
Further information available in each of the subcategories in the navigation menu
The important sections within the console are listed below. Anything not listed is likely not used or not intergrated into the app at this time
Something to note about all the data presented in these sections, none of the data is attributed to individual users for purposes of anonymity and privacy. The tools here allow you to get data on events and see stack traces of crashes, but not directly debug the issues of a specific user.
All analytics, crashlytics, and performance are turned off for non-production environments, with the only exception being DebugView.
Crashlytics
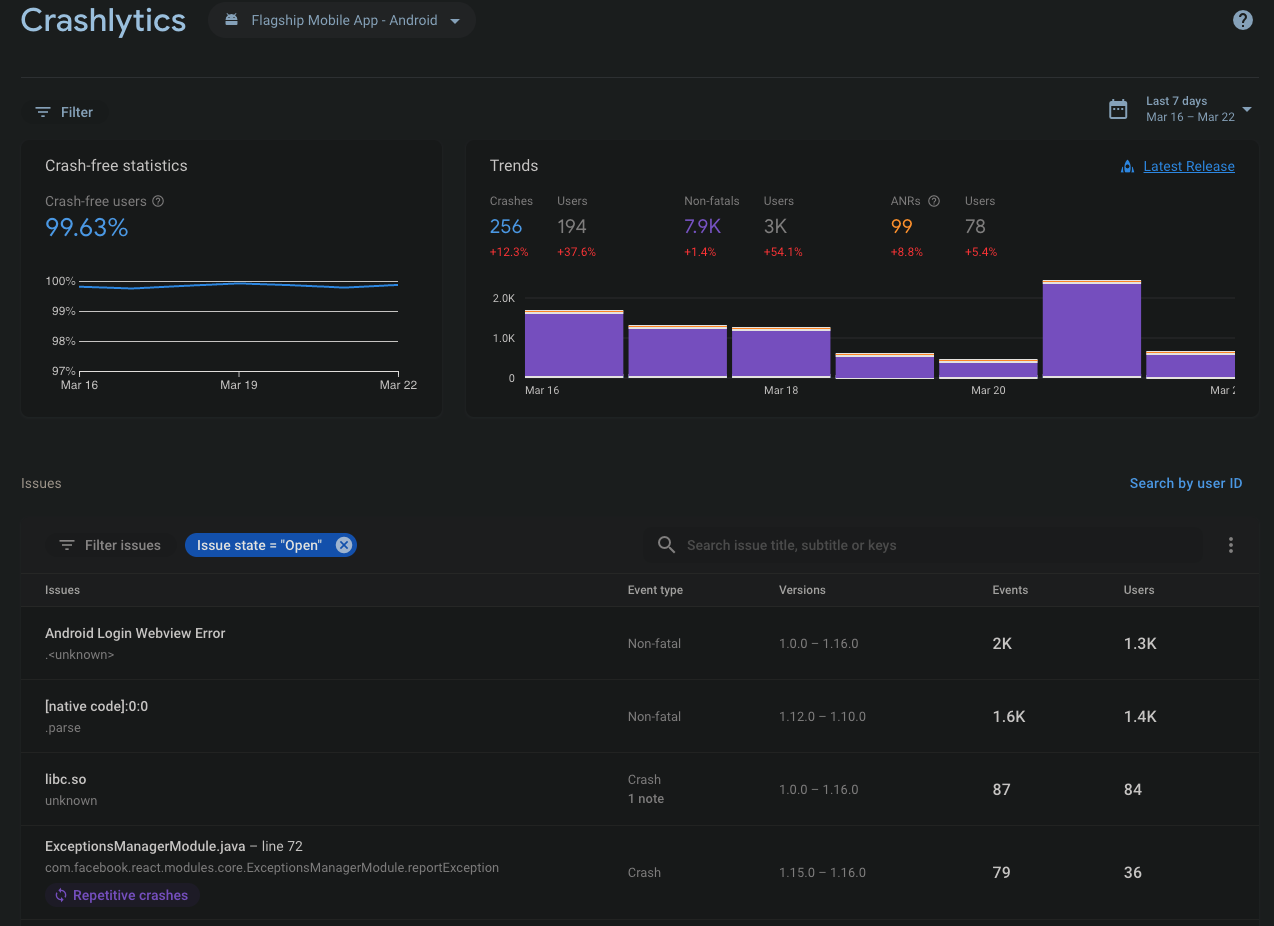
Crashlytics provides metrics on app crashes that occur in production, and can be filtered by release and platform. You'll find the platform dropdown at the top of the page next to the Crashlytics title. The filter at the top left under the title allows you to select which release number to look at and the filter at the top right allows you to choose a different date range.
Crashlytics is added to the app through the @react-native-firebase/crashlytics package. The only code added to the repo which affects Crashlytics is for toggling DebugView and explained in that section.
Performance
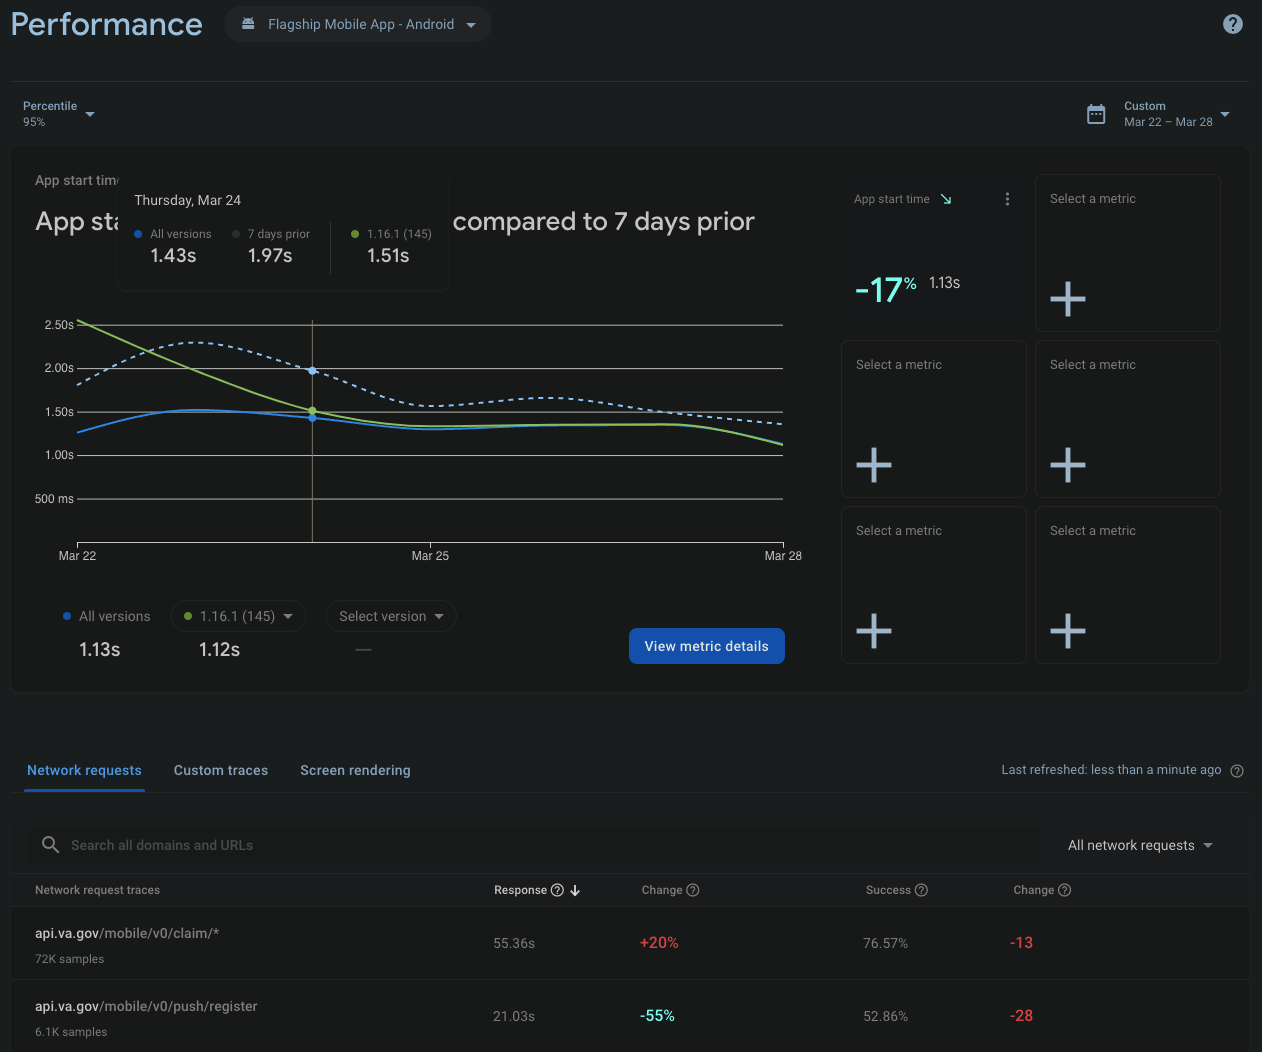
Performance provides many default metrics on http requests and app runtime, and can be filtered by platform. You'll find the platform dropdown at the top of the page next to the Crashlytics title. The filter at the top right allows you to choose a different date range.
Performance is added to the app through the @react-native-firebase/perf package. The only code added to the repo which affects Performance is for toggling DebugView and explained in that section. Additional custom traces can be added to the code by following the examples in the package docs.
App Distribution
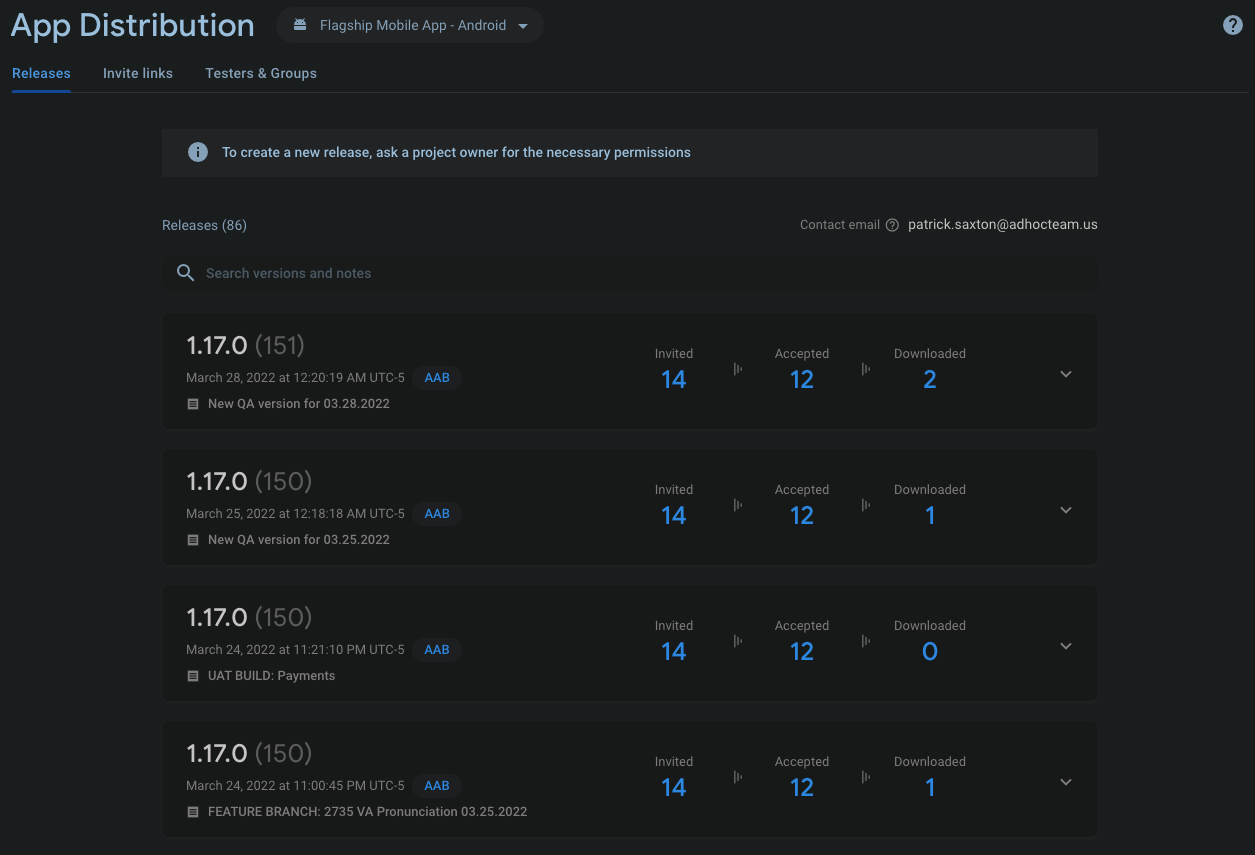
App Distribution provides a dashboard for all the releases of the app. It lists previous releases, allows for creating a new release, provides invite links and group permissions for testers and other groups. Each release contains notes for its purpose, whether it is a QA build or one for UAT or a proper release build. Only people with permissions to use the distribution tools will be able to build new releases. The contact info for the person with top level permission will be listed on that page under Contant Email
Analytics
Analytics provides metrics on discrete events within the app. Most general events like accessing a screen are built into the package and provided in the dashboard without any additional coding, but all other actions like pressing a button or downloading a file are tracked as a custom analytic event. These events are collated and displayed in multiple ways in the Analytics subsections of the nav menu, as listed in the subsections below.
To Add a New Analytics Event
Add an event name with optional parameters to the Events constant in constants/analytics.ts.
Naming Requirements
- Snake case
- Prefixed with
vama_ - Limited to 24 characters including the
vama_prefix
See examples below or in our analytics constants file
Additionally, if user properties need to be tracked, they can be added to the UserAnalytics object:
export const Events = {
  ... ,
  vama_new_event_name: (): Event => {
    return {
      name: 'vama_new_event_name',
      params: {
        paramName,
      },
    }
  },
}

export const UserAnalytics = {
  ... ,
  vama_uses_property: (value: boolean): UserAnalytic => {
    return {
      name: 'vama_uses_property',
      value: value.toString(),
    }
  },
}
Then include the analytics utility functions in your screen or store slice and call the event name:
import { getAnalyticsTimers, logAnalyticsEvent, setAnalyticsUserProperty } from 'utils/analytics'

export const analyticsAction = (): AppThunk => async (dispatch, getState) => {
  await setAnalyticsUserProperty(UserAnalytics.vama_uses_property(true))
  const [totalTime] = getAnalyticsTimers(getState())
  await logAnalyticsEvent(Events.vama_new_event_name(totalTime))
  ...
}
Analytics is added to the app through the @react-native-firebase/analytics package.
Dashboard
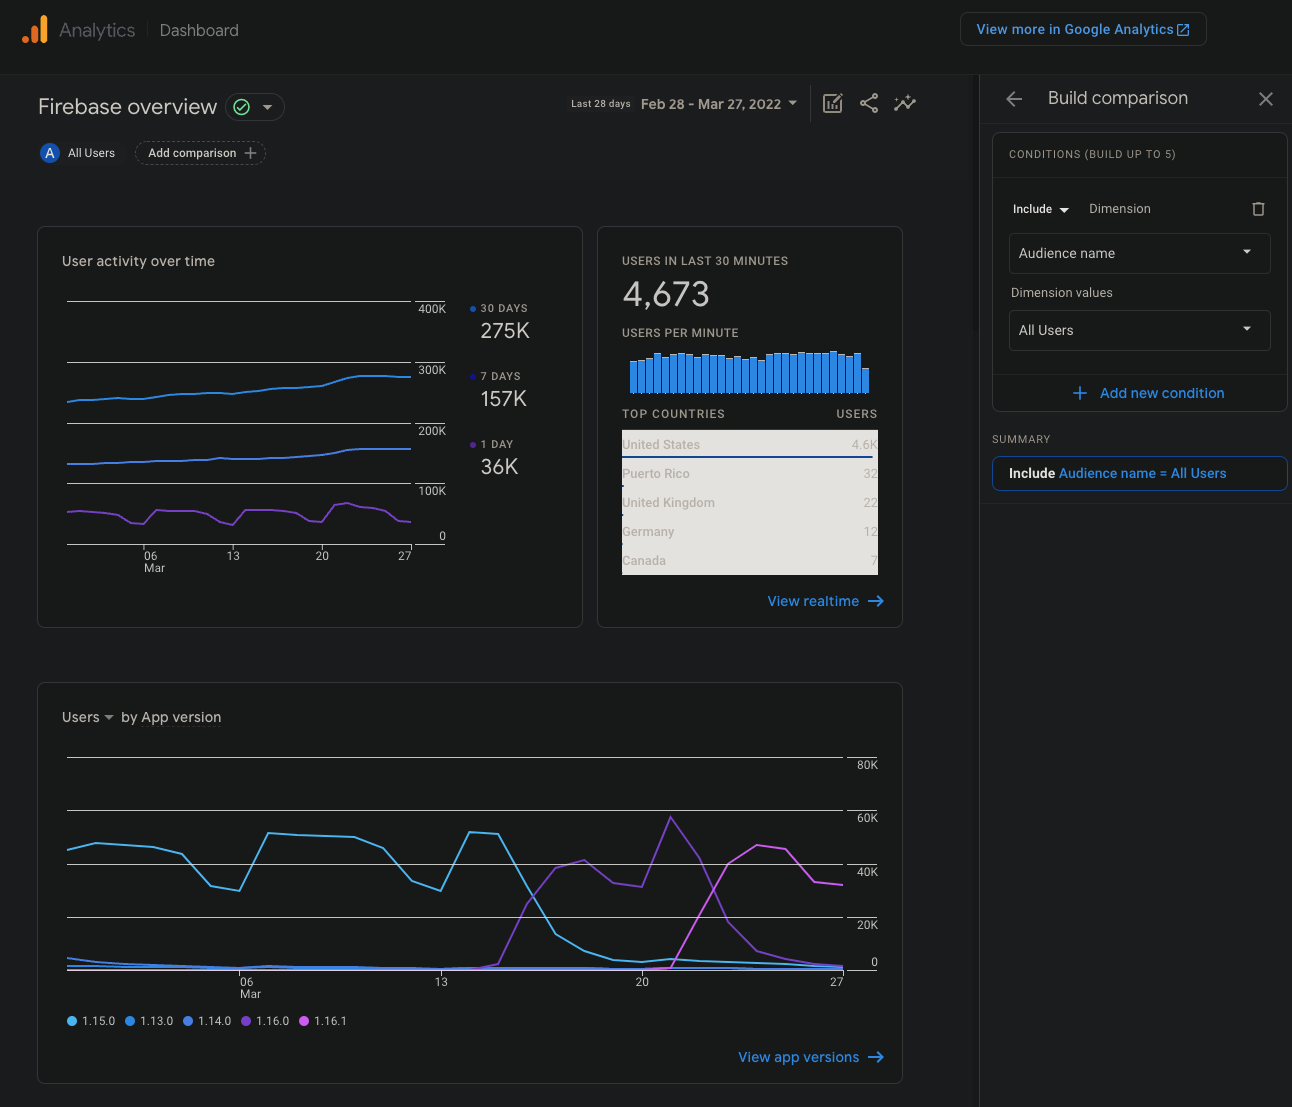
The analytics dashboard provides a few common metrics that are important to the app, like current user engagement, active release versions, and user geolocation. You can drill down into the information on the dashboard by clicking on the All Users button, which will pop open a sidebar which allows you to create a custom query to test the data against, with up to 5 conditions. The time range of the query is in the top-right of the main dashboard, outside of the pop-up. Once a new query is created and Apply is pressed in the bottom right of the pop-up, the data shown will match all provided conditions only. Switching to the Realtime screen within Analytics will also apply these conditions. To clear a query, click on the X next to its name in the top-left where the All Users button used to be.
Realtime
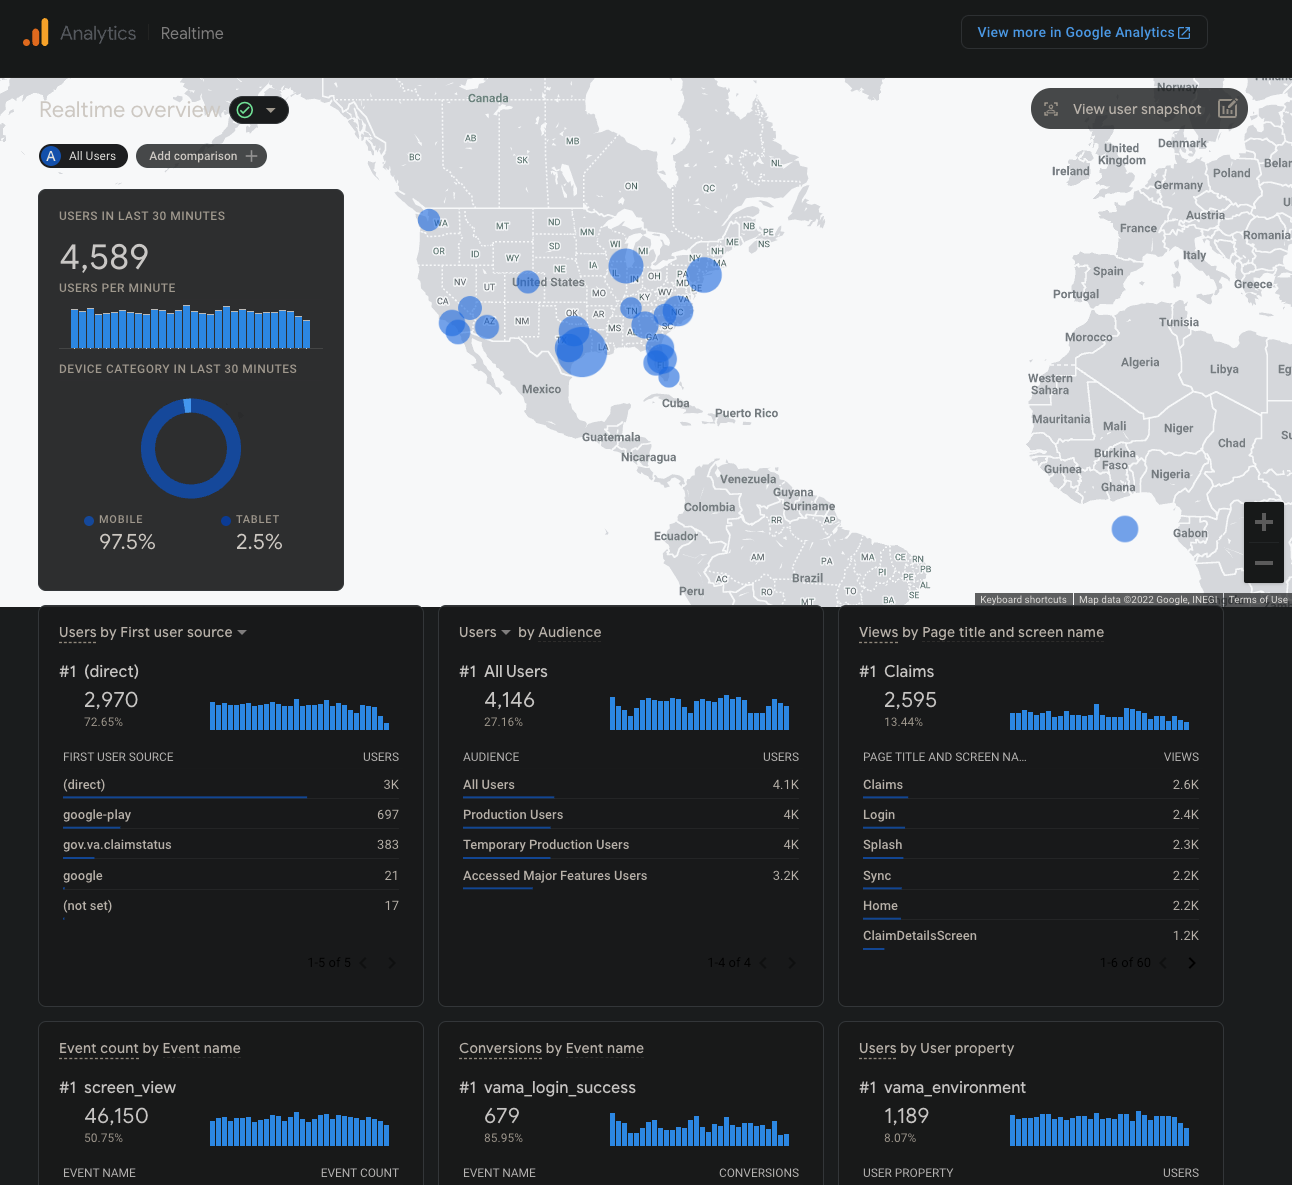
Selecting the Realtime dashboard will show all events that occured within the indicated time range and which match the active query in the comparisons list at the top of the screen. This screen shows the geolocations of all these events grouped to the nearest city. Underneath the map, a breakdown of the event types and rankings of each is also provided.
Events
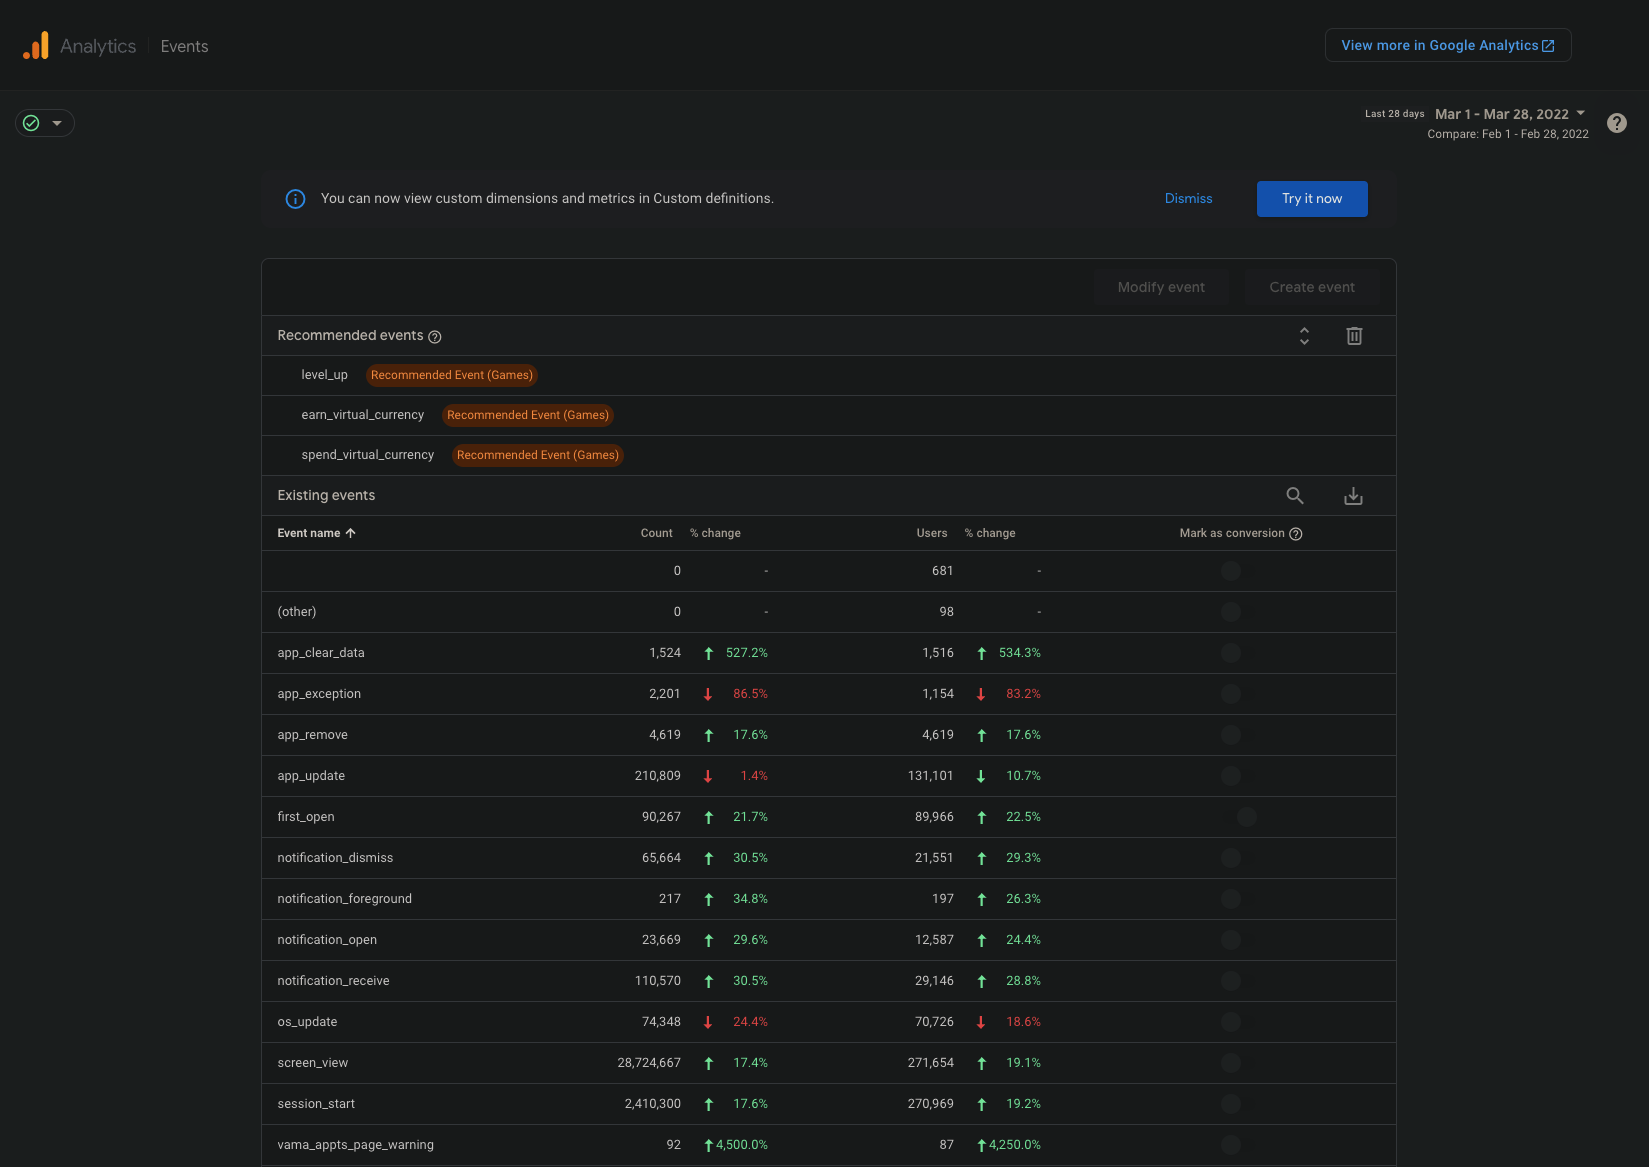
The Events page shows a list of all discrete events in the app, the count of each event firing, and the number of unique users who initiated that event. The events list can be filtered for a specific date range, but no other filters can be applied on this screen.
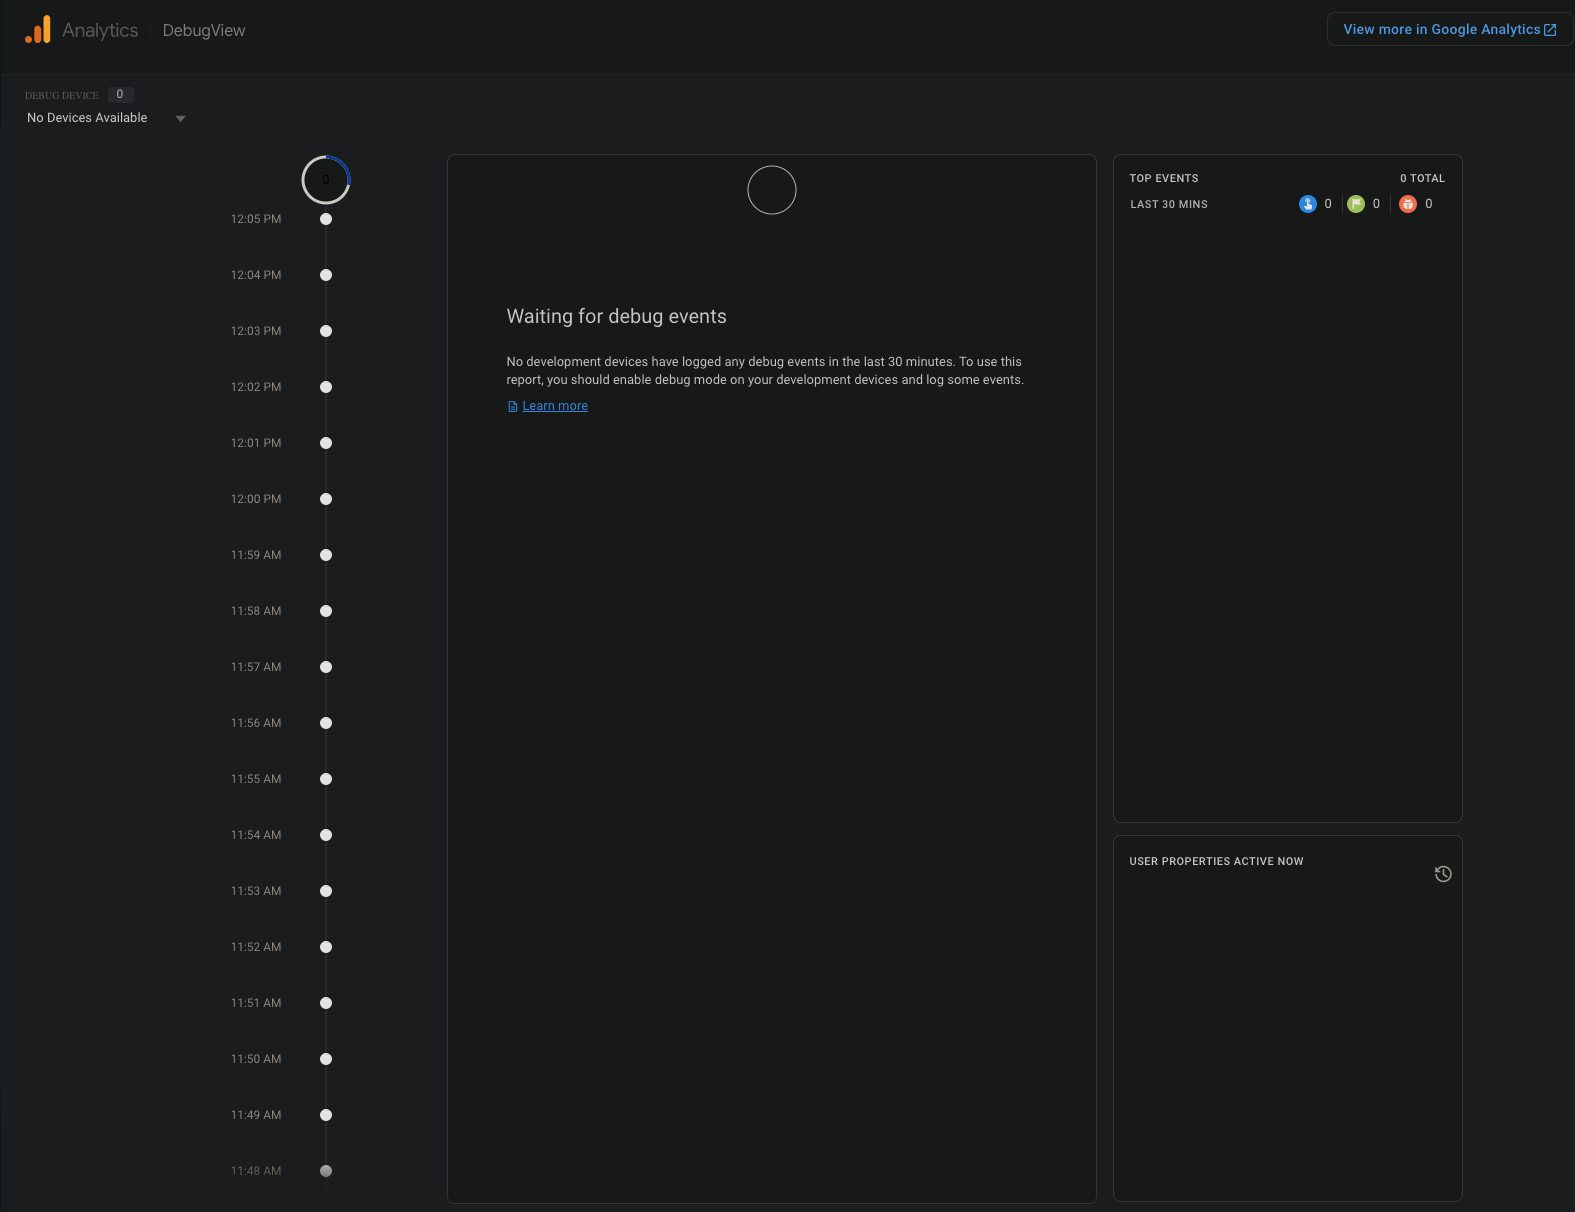
DebugView
DebugView allows developers to get a live stream of events in real-time, with up to a 60 second delay when first starting. A Firebase Debug Mode toggle has been added to the developer screen to make debugging easier.
For developers building locally, follow the steps listed below to get started:
iOS:
- Make sure the
-FIRDebugEnabledflag is enabled in your XCode > Product > Scheme > Edit Scheme, under the Test (Debug) scheme - Start the emulator or build to device
- In the app, go to Profile > Settings > Developer and toggle
Firebase Debug Modeon - Go the Firebase Debug dashboard and select your device from the top left Debug Devices list
Android:
- Open Android Studio and run the emulator or build to device
- In a terminal, execute the command
adb shell setprop debug.firebase.analytics.app gov.va.mobileapp - In the app, go to Profile > Settings > Developer and toggle
Firebase Debug Modeon - Go the Firebase Debug dashboard and select your device from the top left Debug Devices list
- After debugging is complete, run the command
adb shell setprop debug.firebase.analytics.app .none.
For QA team members, DebugView does not work using a signed build. Either build locally using the steps above, or use the steps below, but be aware that the wait time is high and it doesn't always work due to the way events are batched and sent to the Dashboard:
On either platform:
- In the app, go to Profile > Settings > Developer and click
Enable Firebase Debug Mode - Go to the Firebase Realtime dashboard
- Click on the
All Usersbutton at the top left. ABuild Comparisonmenu will pop up. - Set
Audience NametoEnvironmentand theDimension ValuestoStagingif available. If not available, no staging events have been logged in the time period - Click
Applyand any events in that time period that have been logged will be shown on the map and in the lists